pythonで定番のmatplotlibの配色を gnuplot で使う方法です
配色の定義ファイル(color.pal)の作成
以下の内容でテキストファイルを作成します.
私はファイル名は color.pal としました.
set linetype 1 lc rgb '#1f77b4'
set linetype 2 lc rgb '#ff7f0e'
set linetype 3 lc rgb '#2ca02c'
set linetype 4 lc rgb '#d62728'
set linetype 5 lc rgb '#9467bd'
set linetype 6 lc rgb '#8c564b'
set linetype 7 lc rgb '#e377c2'
set linetype 8 lc rgb '#7f7f7f'
set linetype 9 lc rgb '#bcbd22'
set linetype 10 lc rgb '#17becf'
set linetype cycle 10
ポイントは末尾の
set linetype cycle 10
です.11以上のlinetypeを使う場合は,この指定がないと配色が崩れます
定義ファイルのロード
gnuplot を起動して color.pal をロードします
$ gnuplot
gnuplot> load "color.pal"
あとは普通にプロットするだけです.これで matplotlibのデフォルト状態と同じ配色になります
gnuplot> plot sin(x), cos(x)
色見本
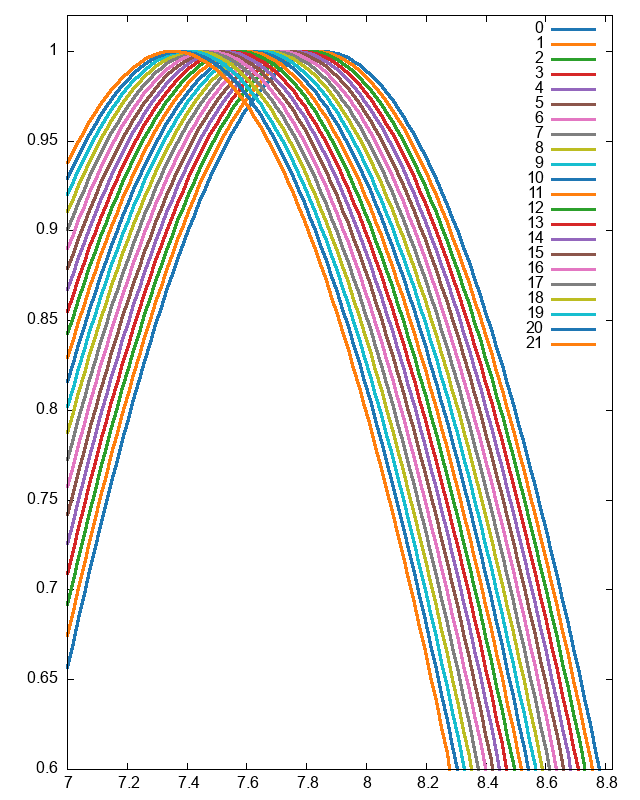
sinカーブを21個重ねています.
set linetype cycle 10
を指定しているので, 配色は10色ごとに繰り返していることが分かるかと思います
matplotlibのパレットを調べる方法
デフォルトの配色は matplotlibの rcParams の "axes.prop_cycle" に保存されています
値は,以下のpythonコードで確認できます
import matplotlib.pyplot as plt
print(plt.rcParams["axes.prop_cycle"])

